During the second week of my three week Easter break, Debbie and I did a little touring in the southwest of England. Not so far from where we were over the Christmas break. The nice thing is that it is close by so we don’t have to travel for hours and there is so much to see–why go further. So, hold on–fasten your seat belt–this is going to be a long one but I hope you enjoy it.
We stopped first in Winchester to make a clock connection but also got a look at the cathedral and the Great Hall which is all that remains of Wolvesey Castle from the early 12th century. This place is famous because it houses a facsimile King Arthur’s round table, hung high on a wall. It was apparently unpainted originally but spruced up for Henry VIII in 1522. Who knows what the real story of this table is but it is at least known to have existed here since at least 1463–not a real youngster.
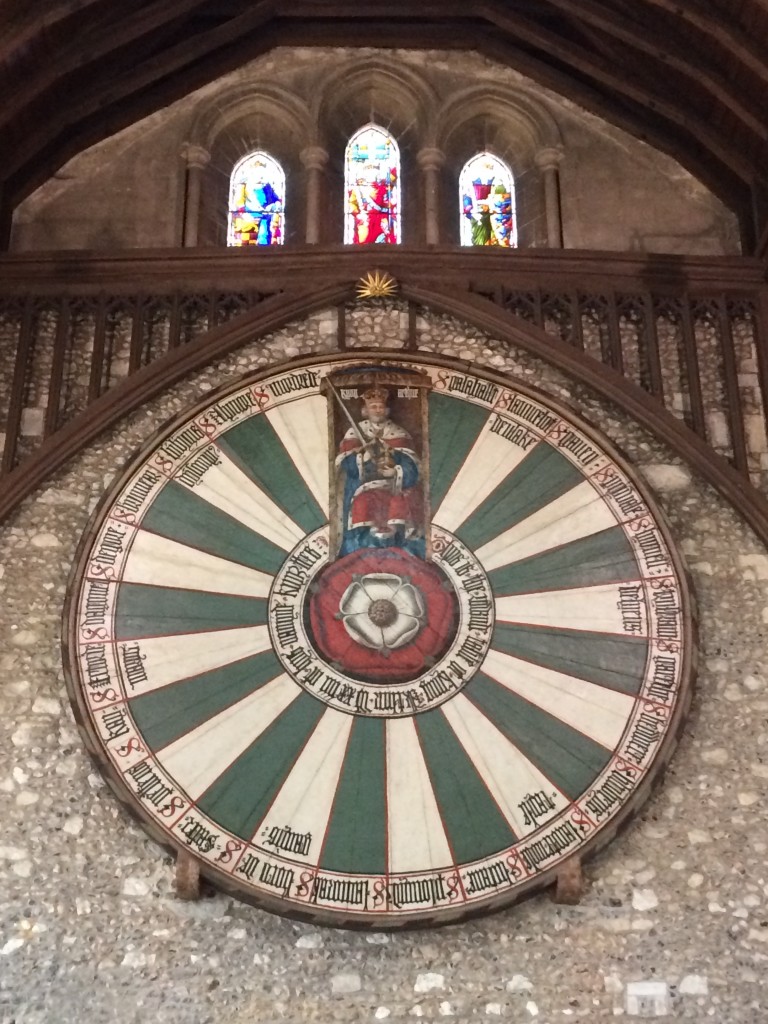
The round table, about 20 feet across, with King Arthur on top and the names of 24 knights written around the perimeter.

For those intersted in geneology, this family tree was painted on the wall opposite the Round Table in the Great Hall.
Next on the agenda–on our way to Bath–was Highclere house–made famous as the location for Downton Abbey television series. It is awesome–but I am glad we came when we did–the crowds of visitors tend to detract from the enjoyment (at least for me).
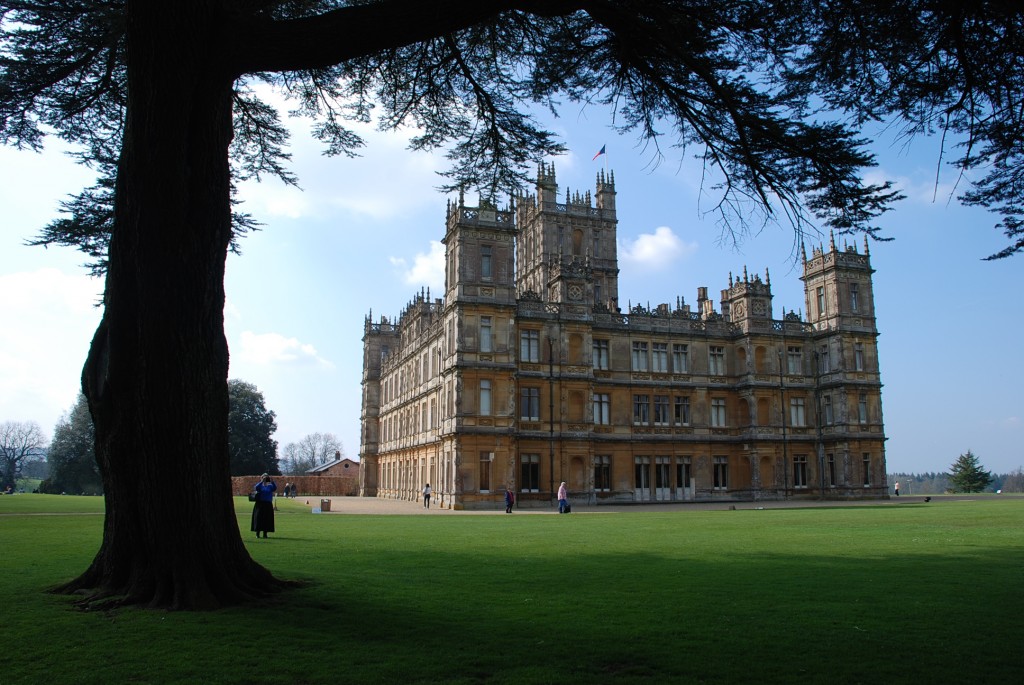
Highclere Castle (Downton Abbey) – an impressive structure!

Even more impressive when you look close.
Next stop was our B&B for a good night’s sleep. In the morning we were off to see the Roman baths in Bath (where else)? Bath also has some interesting architecture with long expansive rows of apartment houses (flats).

The main bath. There are many other rooms. This area originally had a ceiling. Note the statues around the top.
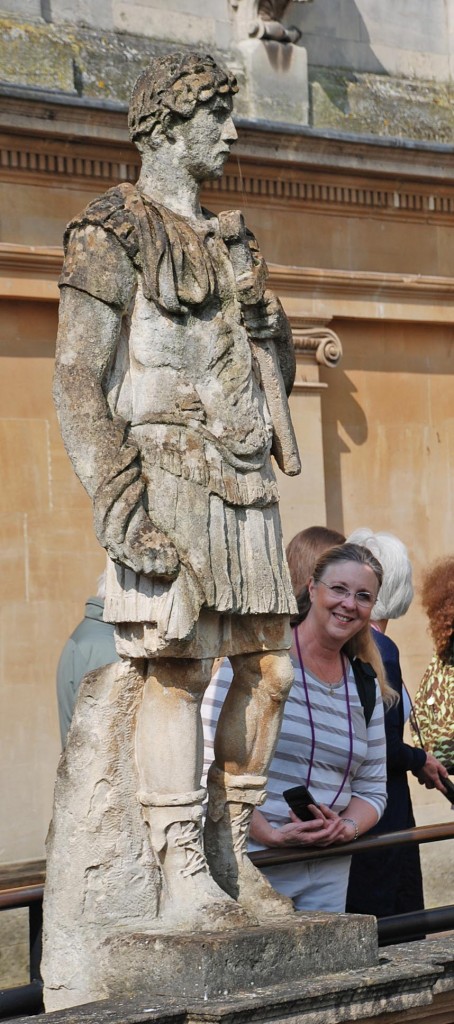
Debbie stands next to a one of the statues, a “family friend”, Hadrian.

This place does have a hotel in the middle called The Royal Crescent, but is mostly personal flats. An amazing building!
Next, a short stop at an old 15th century manor home, Westwood Manor, on the way back to our B&B for the night. There seem to be dozens of these scattered around England and we bought a membership to the National Trust that enables us to visit them for free. This one has surprisingly great artifacts; musical instruments, clocks, paintings–and my favorites, beside the clock (there was a welsh clock here too) are the doors and hinges.
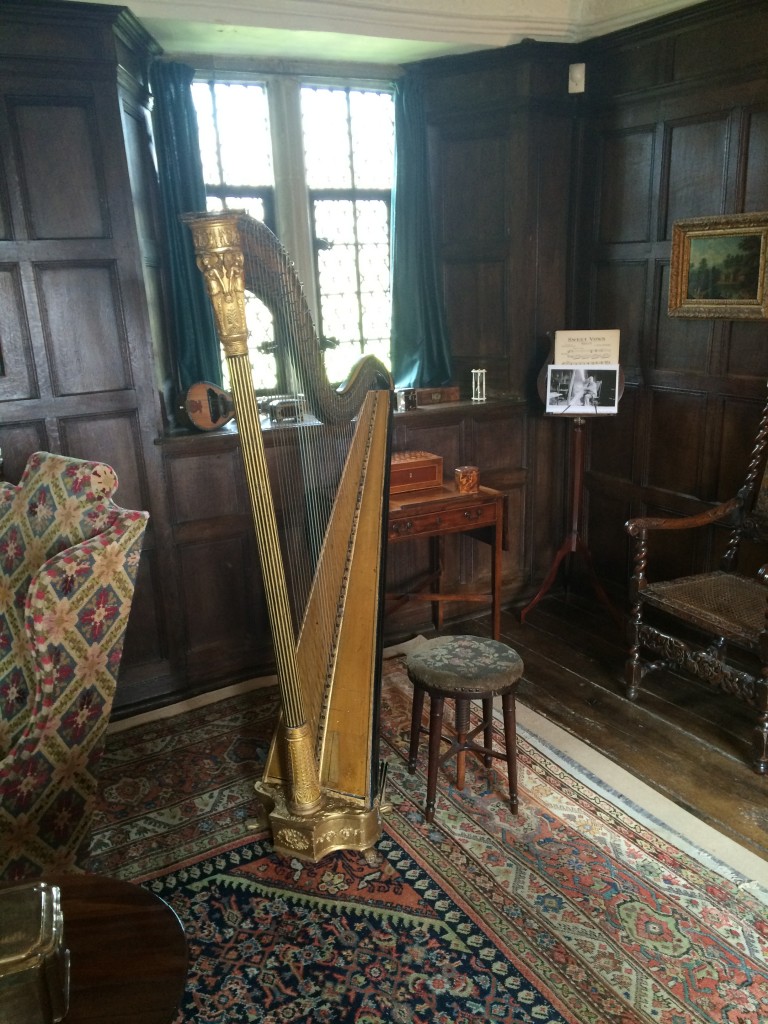
A gilded harp is a lovely addition to the room. You don’t see these very often.
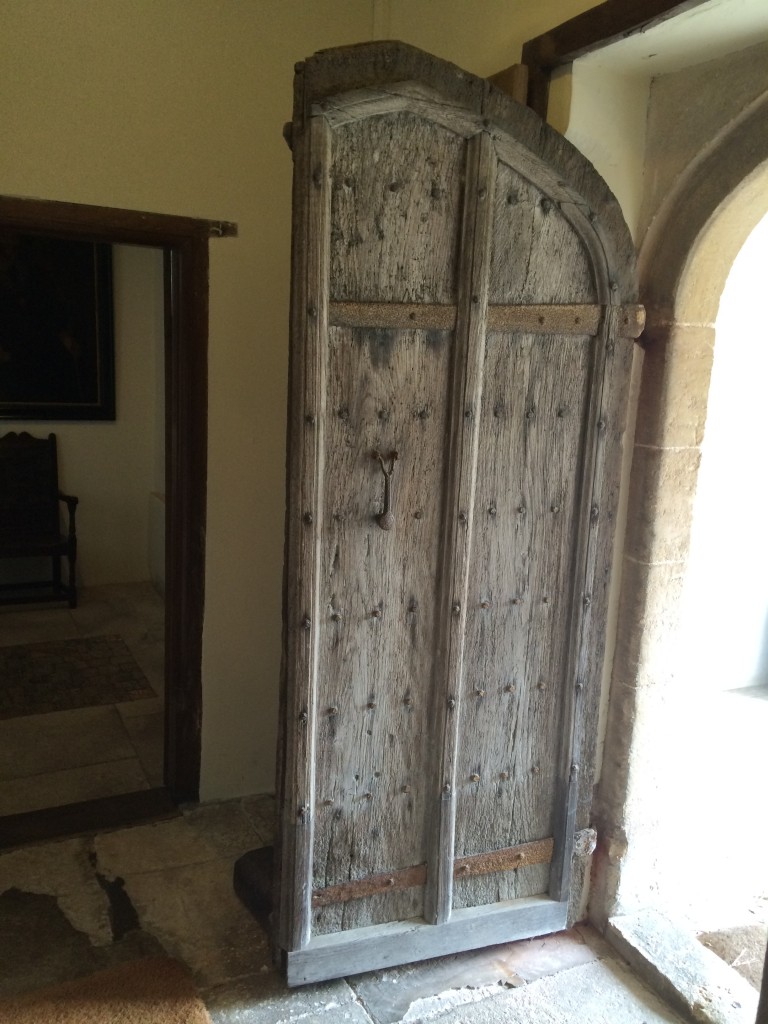
I could only hope to look this good if I was 600 years old.
By chance, the B&B we rented was near the little town of Westbury. It is well known for the white horse carved into a natural chalk hillside. The current version of this has been around for at least 500 years but some think many more than that. On top of the hill is what is known as Bratton Castle, an Iron Age fortress. Not much left now but the large ditches presumably around the perimeter of the castle to make a good defensible space.
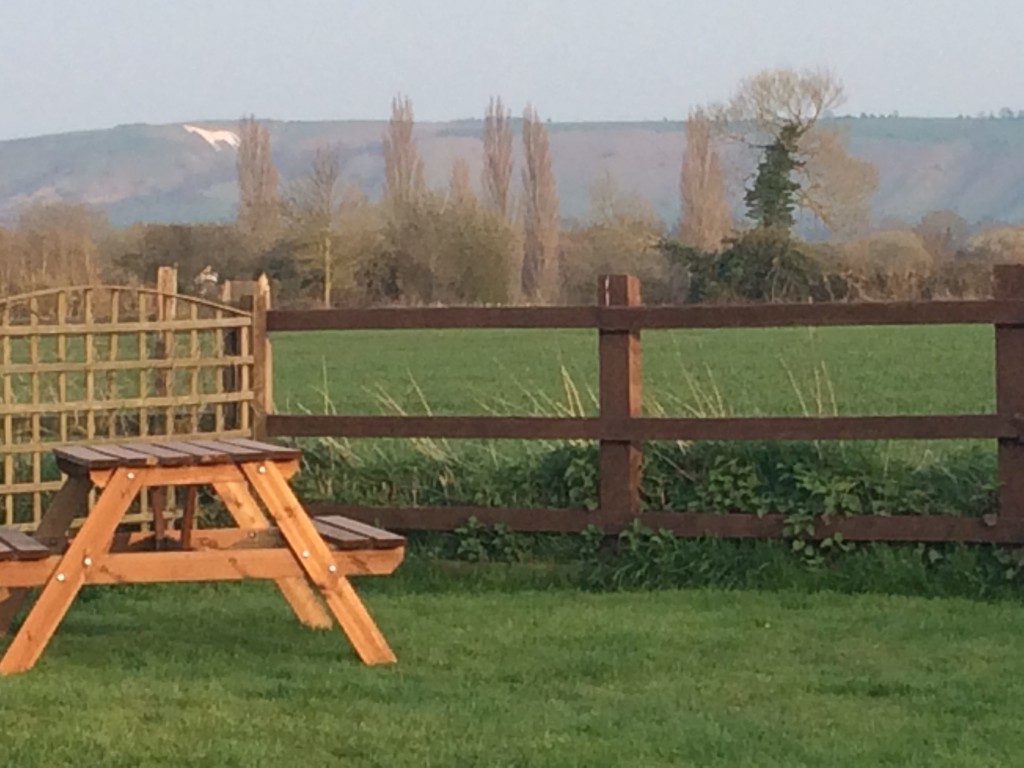
We were surprised to see the white horse in the distance when we stopped at a pub in Westbury for dinner.
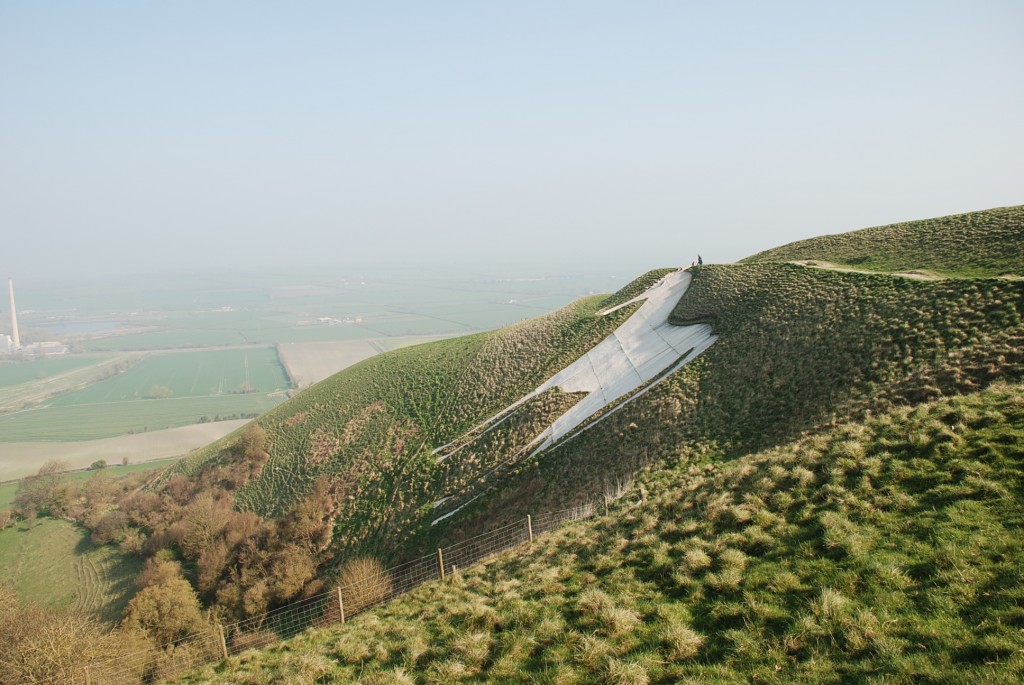
The hike up to see the White Horse was fun, unfortunately kind of a hazy day so the views were not as spectacular as might have been.
After Westbury, we headed home but not before checking in first at Wells to see the Wells cathedral. Initially, the draw for going was to see a medieval clock in the cathedral. This is said to be the oldest original clock face of its kind in the world. The original mechanism for this clock, currently in the Science Museum, London, are thought to be the second oldest in Britain. There is a performance by the clock every 15 minutes–jousting knights run around and knock each other down. Aside from the clock, the cathedral itself is the most amazing I have seen, maybe even better than Notre-Dame in Paris! It is enormous for starters but it has wonderful scissor like stone structure on the inside as well as very large stained glass windows and a very large pipe organ. You really have to see this one to get the feel of it.

Absolutely Awesome! I mean that literally–awesome. It is hard to get the sense of it from a photo.

Some of the best stained glass I have ever seen.
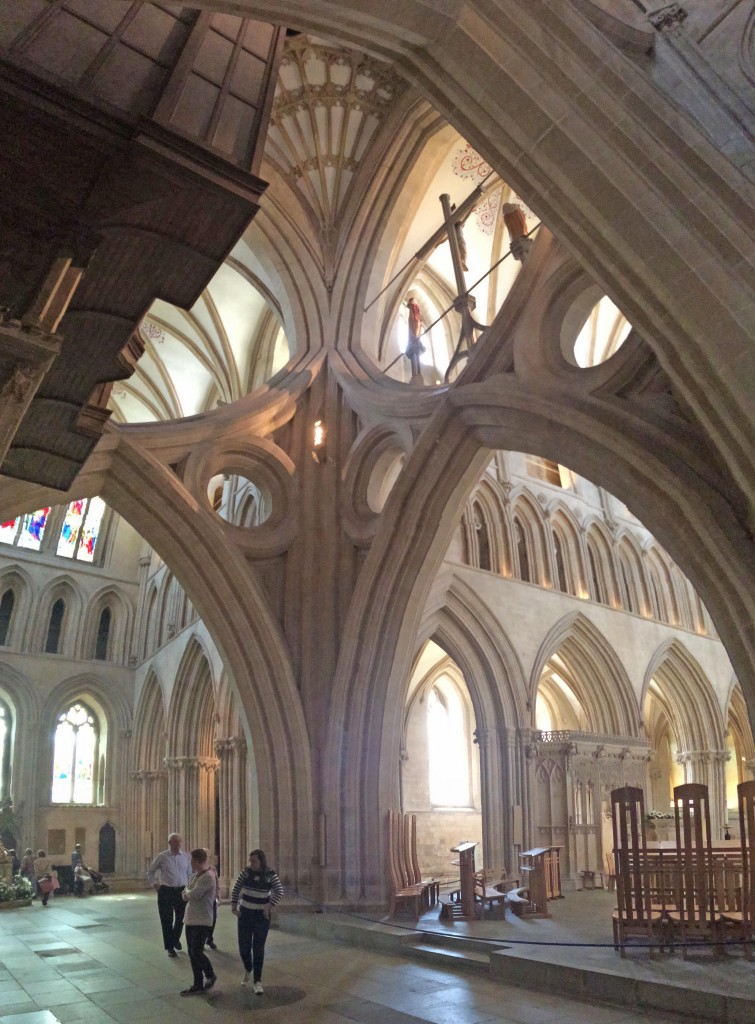
Apparently these criss-crossing arches are unique and were added (in 1313) to stop the tower from falling down after cracks in the structure were discovered.
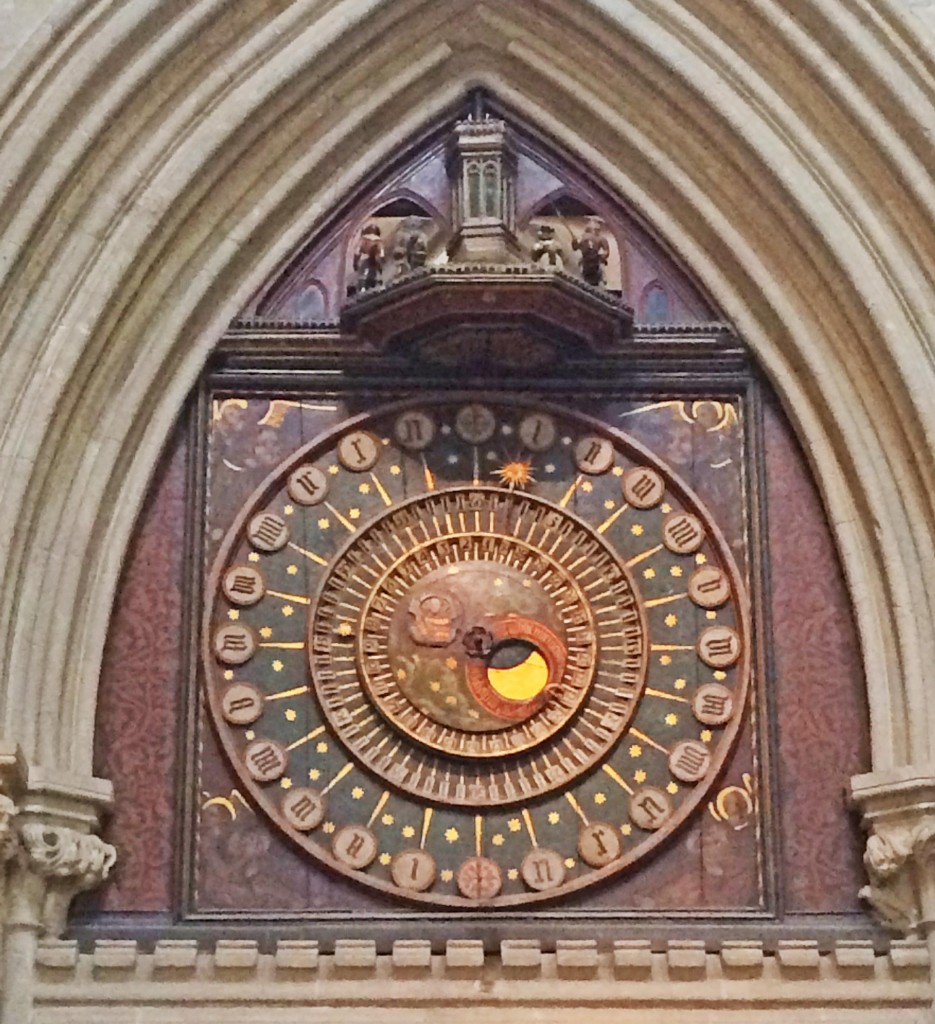
Of course, I have to include the clock. This one has an original dial from the late 1300s–the second oldest remaining clock in England. At the time this clock was made people still thought the sun revolved around the earth. The dial shows the sun revolving around the earth and indicating the hours. Copernicus first challenged the belief in 1543. Above the dial, knights joust every 15 minutes. After the clock strikes on the hours a live priest says a pray–a nice touch, I thought; changes the focus from what man has done to what God has done.
One more stop on the way home was to Stourhead. This is a large estate with a long and storied history, and a perhaps typical, large estate house–huge library, lots of paintings and sculpture–a bit Downton Abbey like. And there are also large grounds and natural gardens, that Highclere doesn’t have. We didn’t have as much time as we might have liked but certainly enough to be awed and appreciative both of the natural beauty but also of the massive effort it must have taken for a family to build something like these places.

The main house at Stourhead.
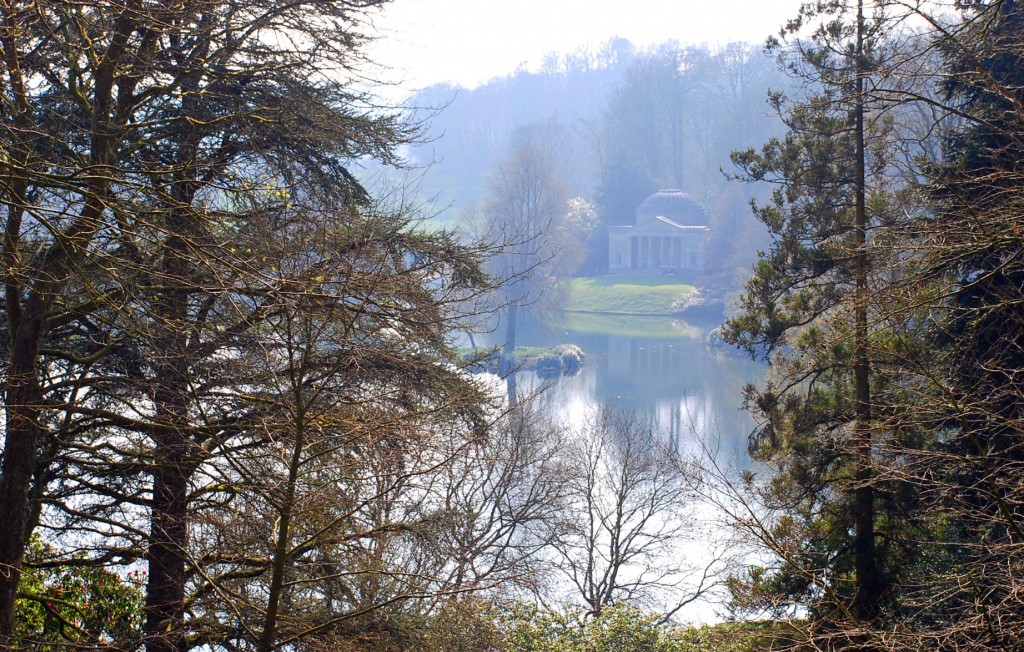
A picturesque scene created by man.

The rooms are full of paintings–there certainly isn’t the time to study them. Many are of religious themes–notice the three wise men bringing gifts to the baby Jesus in the center painting.
Back home then and I have some serious work to do completing a 2000 word essay on the intangible and ethical aspects of my Master’s conservation project–want to trade places?
We’re off to Spain next week–cheers,






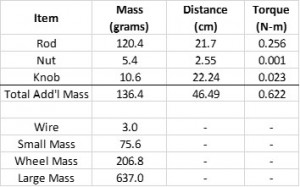
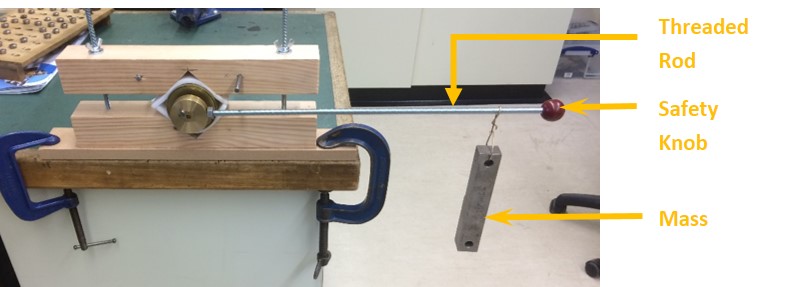
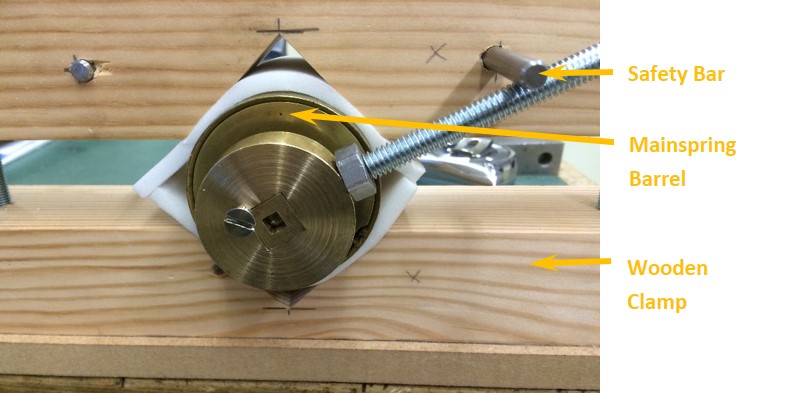
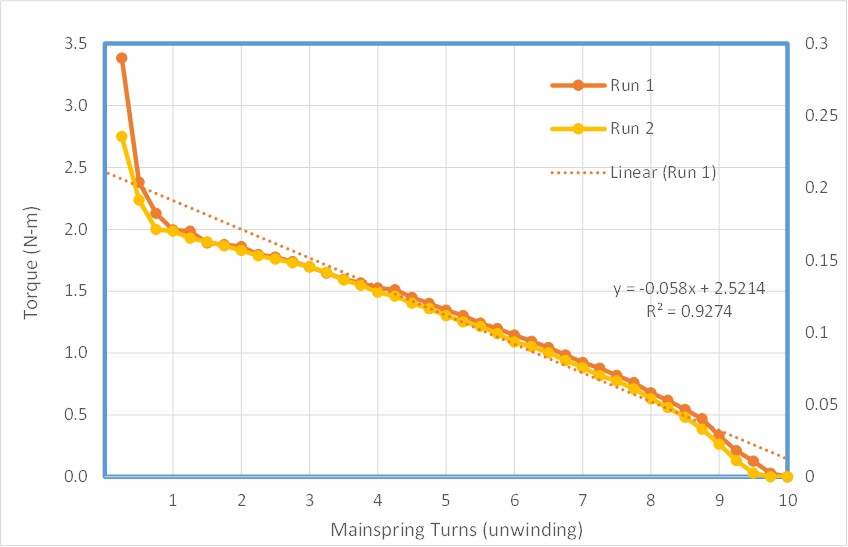 This chart is almost what I expect to see except that it is more linear than I thought it would be. The interpreted linear line shown on the graph shows how the actual torque deviates from perfectly linear. As I test other springs, this will be one point of comparison. The chart shows a high degree of non-linearity as the spring first begins to unwind. As I wound the mainspring I was able to feel that there was friction in the mainspring and barrel as I rotated it with a high number of turns. Also shown on the chart is the equation of the calculated linear regression line and the R-squared value which is a measure of how well the actual data points fit to the straight line. This will be one good way to measure the differences between springs.






Recent Comments